10 min read
How to Test Your Shortcuts: From Basic Debugging to Advanced Logging
By Shortcut Actions Team
|Published Sunday, December 14, 2025
Building complex Shortcuts workflows can be challenging, especially when things don't work as expected. Without proper testing and debugging tools, you might find yourself running your shortcut dozens of times, trying to figure out where things went wrong.
In this comprehensive guide, you'll learn how to validate and test your Shortcuts effectively - starting with basic native methods and progressing to advanced logging and debugging techniques that will save you hours of frustration.
Why Testing Shortcuts Is Challenging
Unlike traditional programming environments with debuggers and breakpoints, Apple Shortcuts runs your workflow from start to finish with limited visibility into what's happening at each step. You can't easily:
- See the value of variables at different points in your workflow
- Track which path your logic takes through conditional branches
- Inspect complex data structures like JSON objects
- Review a history of your shortcut's execution over time
Let's explore how to overcome these challenges.
Method 1: Native Quick Look (The Basic Approach)
The most straightforward way to test a Shortcut is using the built-in Quick Look action. This displays the current value in a preview window, allowing you to see what data looks like at any point.
How to Use Quick Look
- Add a Quick Look action at the point where you want to inspect data
- Pass the variable or output you want to examine
- Run your shortcut and view the preview
When Quick Look Works Well
- Simple text values: Perfect for checking strings, numbers, or simple lists
- Image verification: View photos or generated images before processing
- Quick checks: Fast way to verify a single value during development
Limitations of Quick Look
- Interrupts workflow: Requires manual dismissal, breaking automation
- No history: You can't review previous runs or compare results
- Poor for complex data: JSON objects and nested structures are hard to read
- Single value only: Can only view one thing at a time
Method 2: Set Variable for Later Inspection
Another native approach is to store values in variables and inspect them at the end of your workflow or after errors occur.
Basic Pattern
1. Set Variable [DebugValue] to [Result]
2. [Continue with workflow...]
3. Show Result [DebugValue]
Advantages
- Non-intrusive during workflow execution
- Can collect multiple values throughout the shortcut
- Useful for comparing before/after states
Drawbacks
- No context: Hard to remember what each variable represents
- Limited to current run: Previous execution data is lost
- Clutters workflow: Multiple debug variables make shortcuts messy
- Manual cleanup: Need to remove debug code before deployment
Method 3: Show Notification (Silent Logging)
For workflows that run in the background or as automations, showing notifications can provide basic visibility.
Use Case
Show Notification
  Title: "Processing Step"
  Body: [CurrentValue]
When This Helps
- Background automations where you can't use Quick Look
- Checking if a workflow reached a specific point
- Seeing values without interrupting the flow
Problems with Notifications
- Clutters notification center: Fills up quickly during testing
- Limited content: Can't display complex data structures
- No organization: Hard to track multiple workflows
- Temporary: Notifications disappear and can't be reviewed later
The Problem: None of These Scale
While these native methods work for simple shortcuts, they fall apart when:
- You're debugging complex workflows with multiple branches
- You need to track values across many execution steps
- You want to compare output from different runs
- You're working with JSON data or complex objects
- You need to share debugging information with others
This is where Shortcut Actions transforms your debugging workflow.
Method 4: Advanced Logging with Log Console
Shortcut Actions introduces a professional logging system called Log Console - think of it as a developer console for your Shortcuts workflows.

Key Features
Named Log Files: Create separate logs for different shortcuts or projects Log Levels: Mark entries as debug, info, success, warning, or error Run Grouping: Entries are automatically grouped by execution run Persistent History: Review logs from hours, days, or weeks ago Rich Metadata: Add labels, tags, and context to each entry Searchable: Find specific entries across all your logs
Getting Started with Logging
Step 1: Create a Log File
At the start of your shortcut, add the Create Log action:
Create Log "Leftover Recipes Logs"
  Clear Previous: false
  Add Run Marker: true
This creates a named log file (or activates an existing one) and adds a marker showing when this run started.
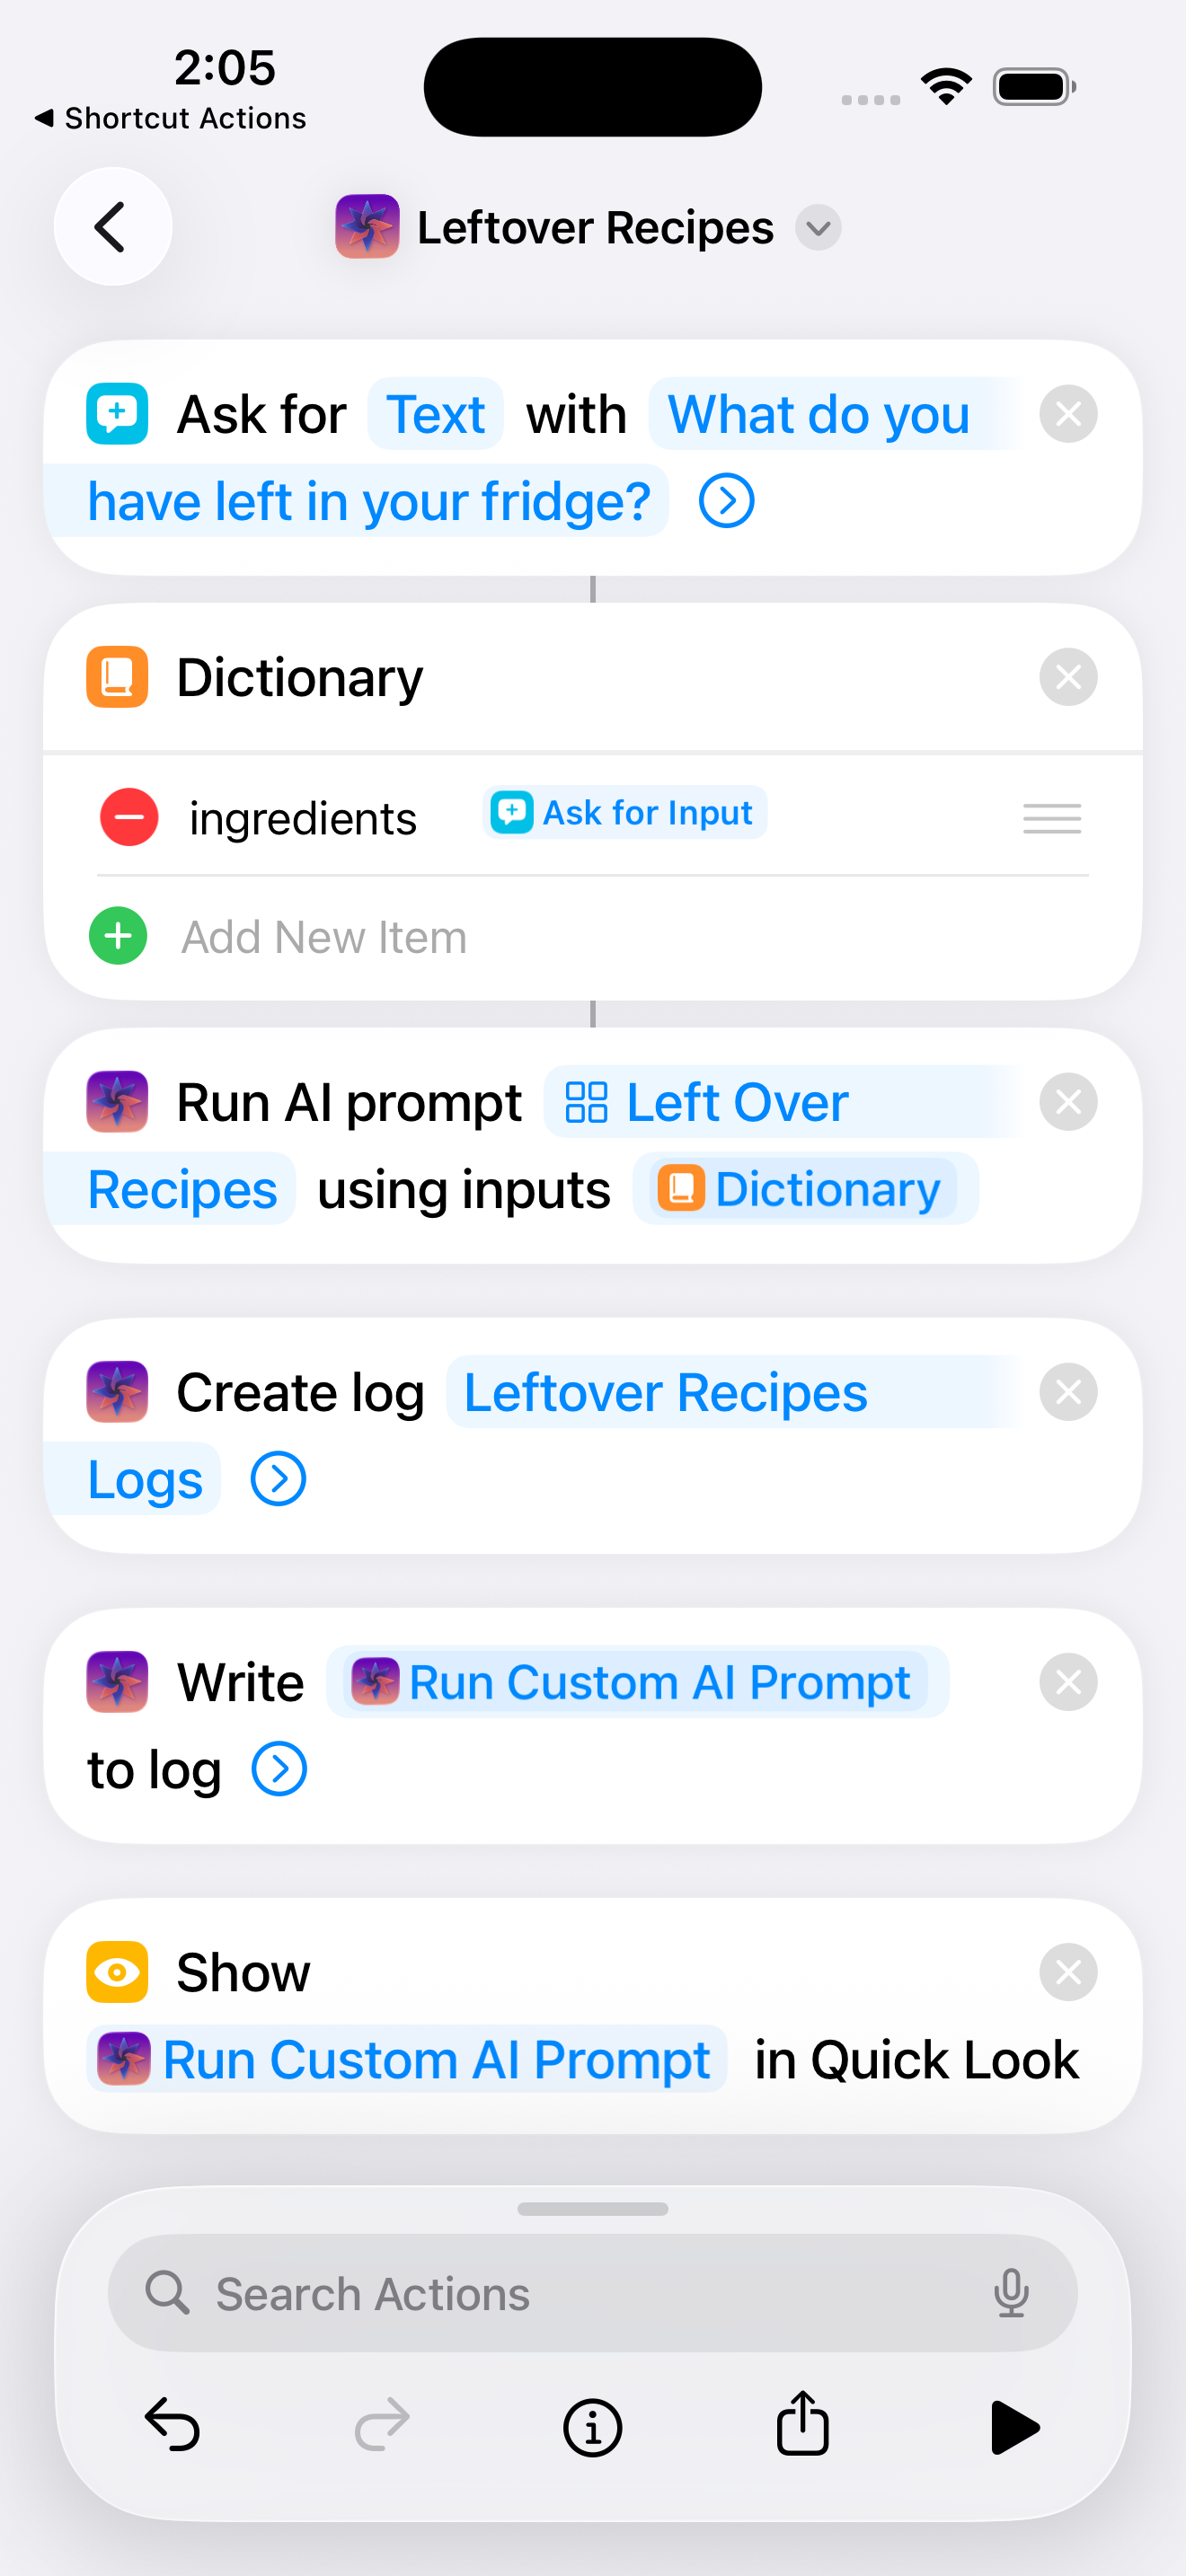
Step 2: Write Log Entries
Throughout your workflow, use Write to Log to record important values:
Write to Log [RecipeResult]
  Label: "AI Generated Recipe"
  Level: Info
  Tag: "recipe"
You can log at different severity levels:
- Debug: Detailed technical information (gray)
- Info: General information (blue)
- Success: Successful operations (green)
- Warning: Potential issues (orange)
- Error: Error conditions (red)
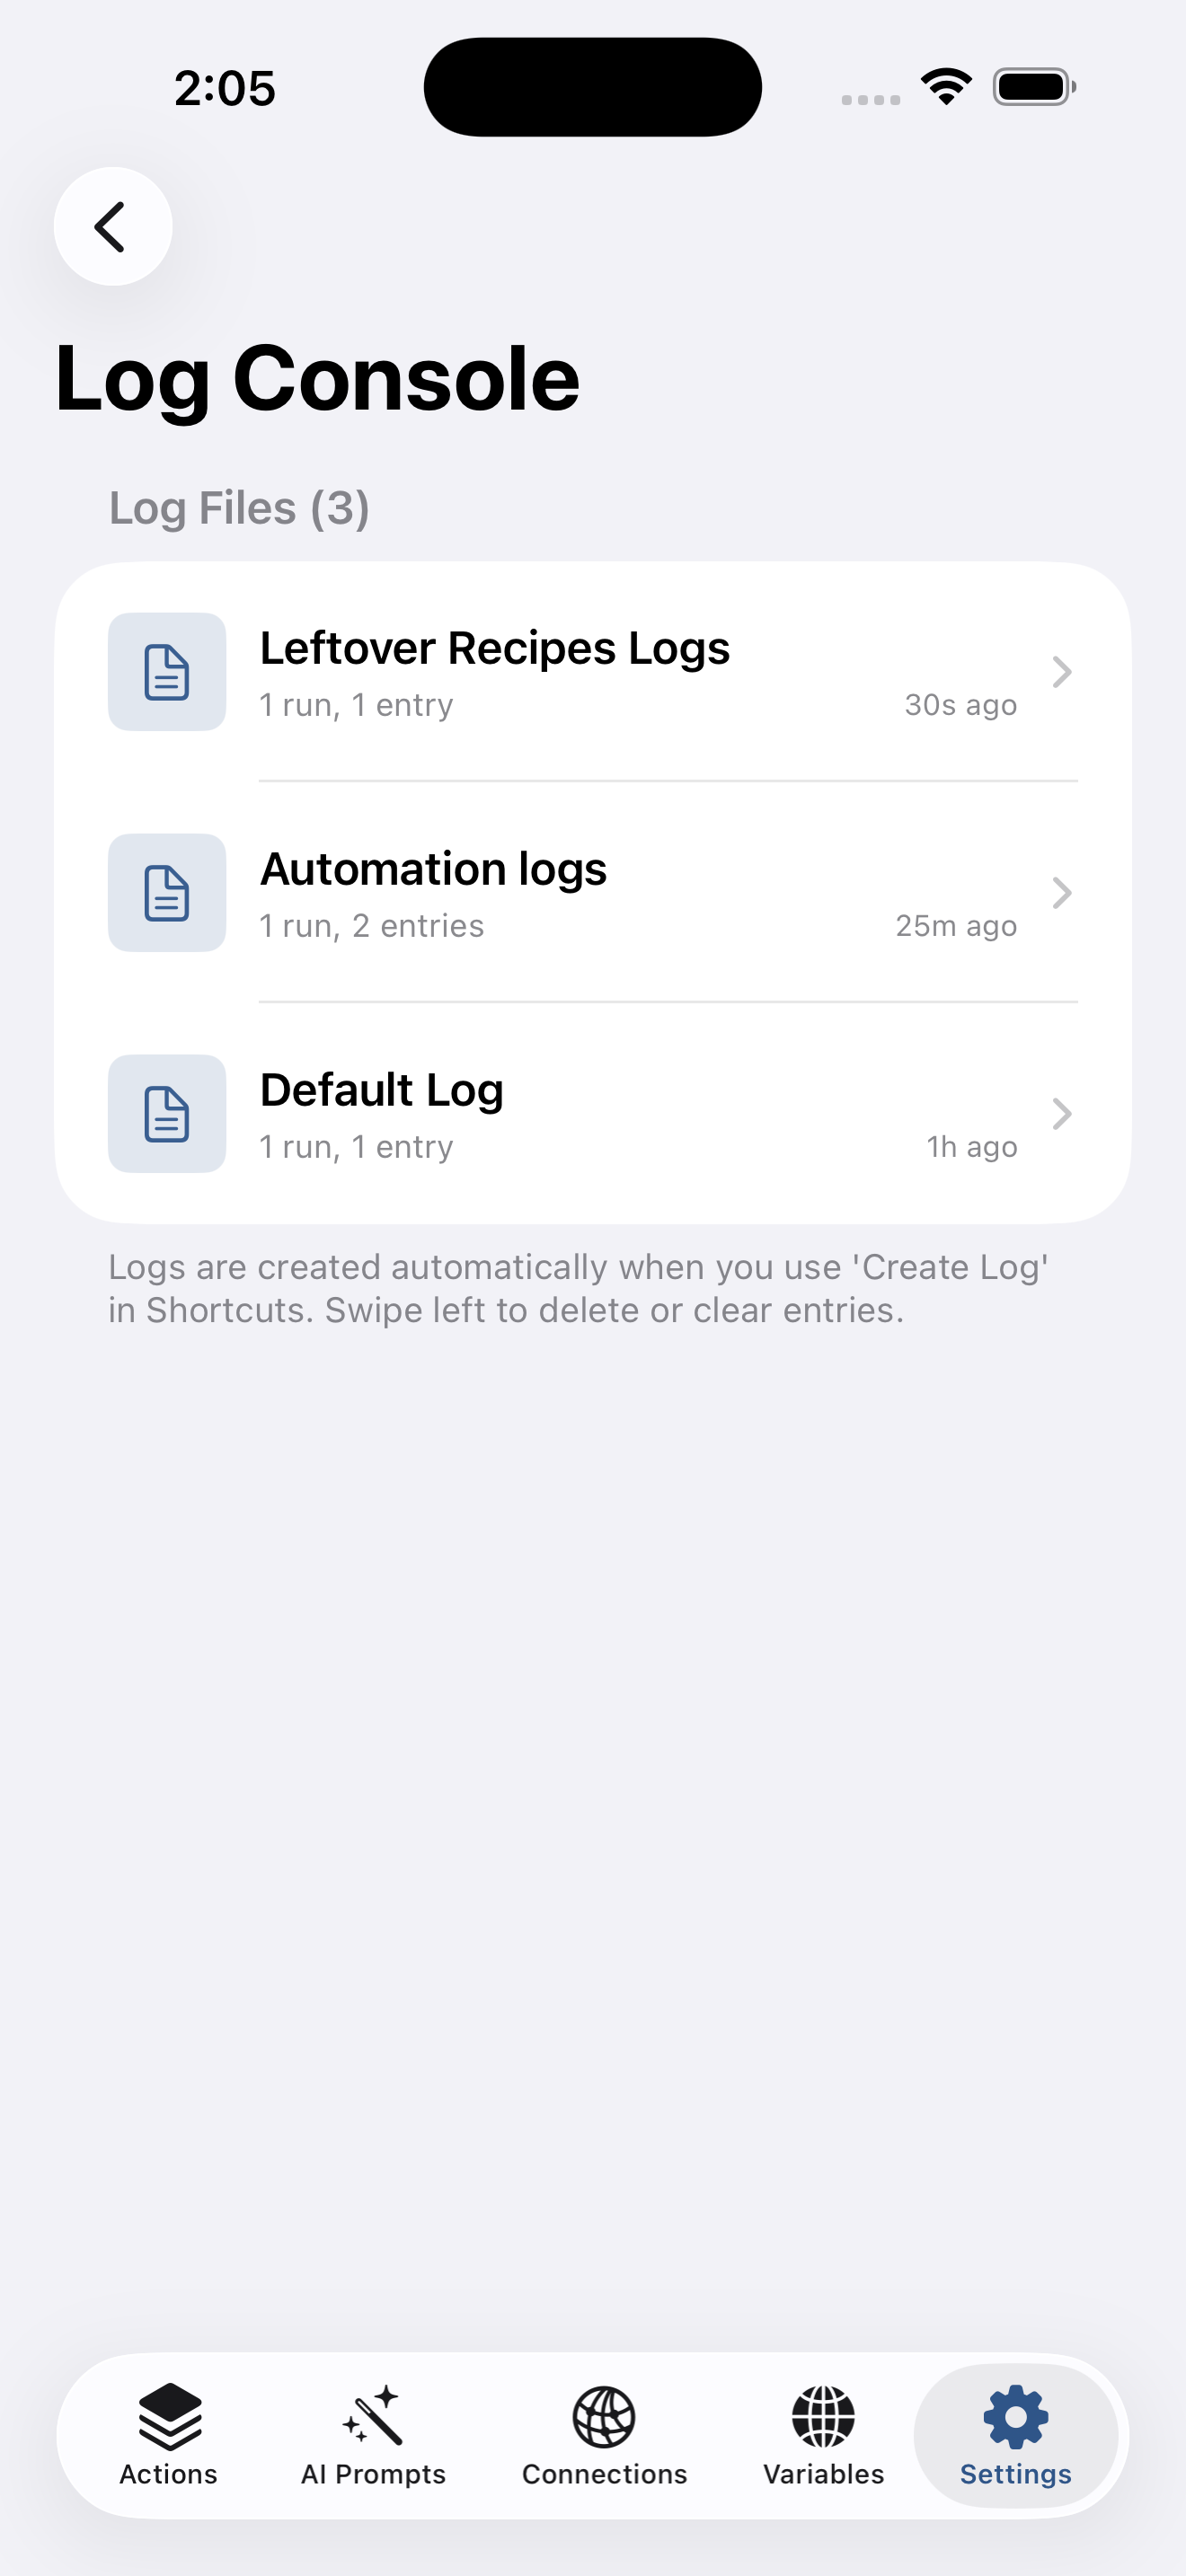
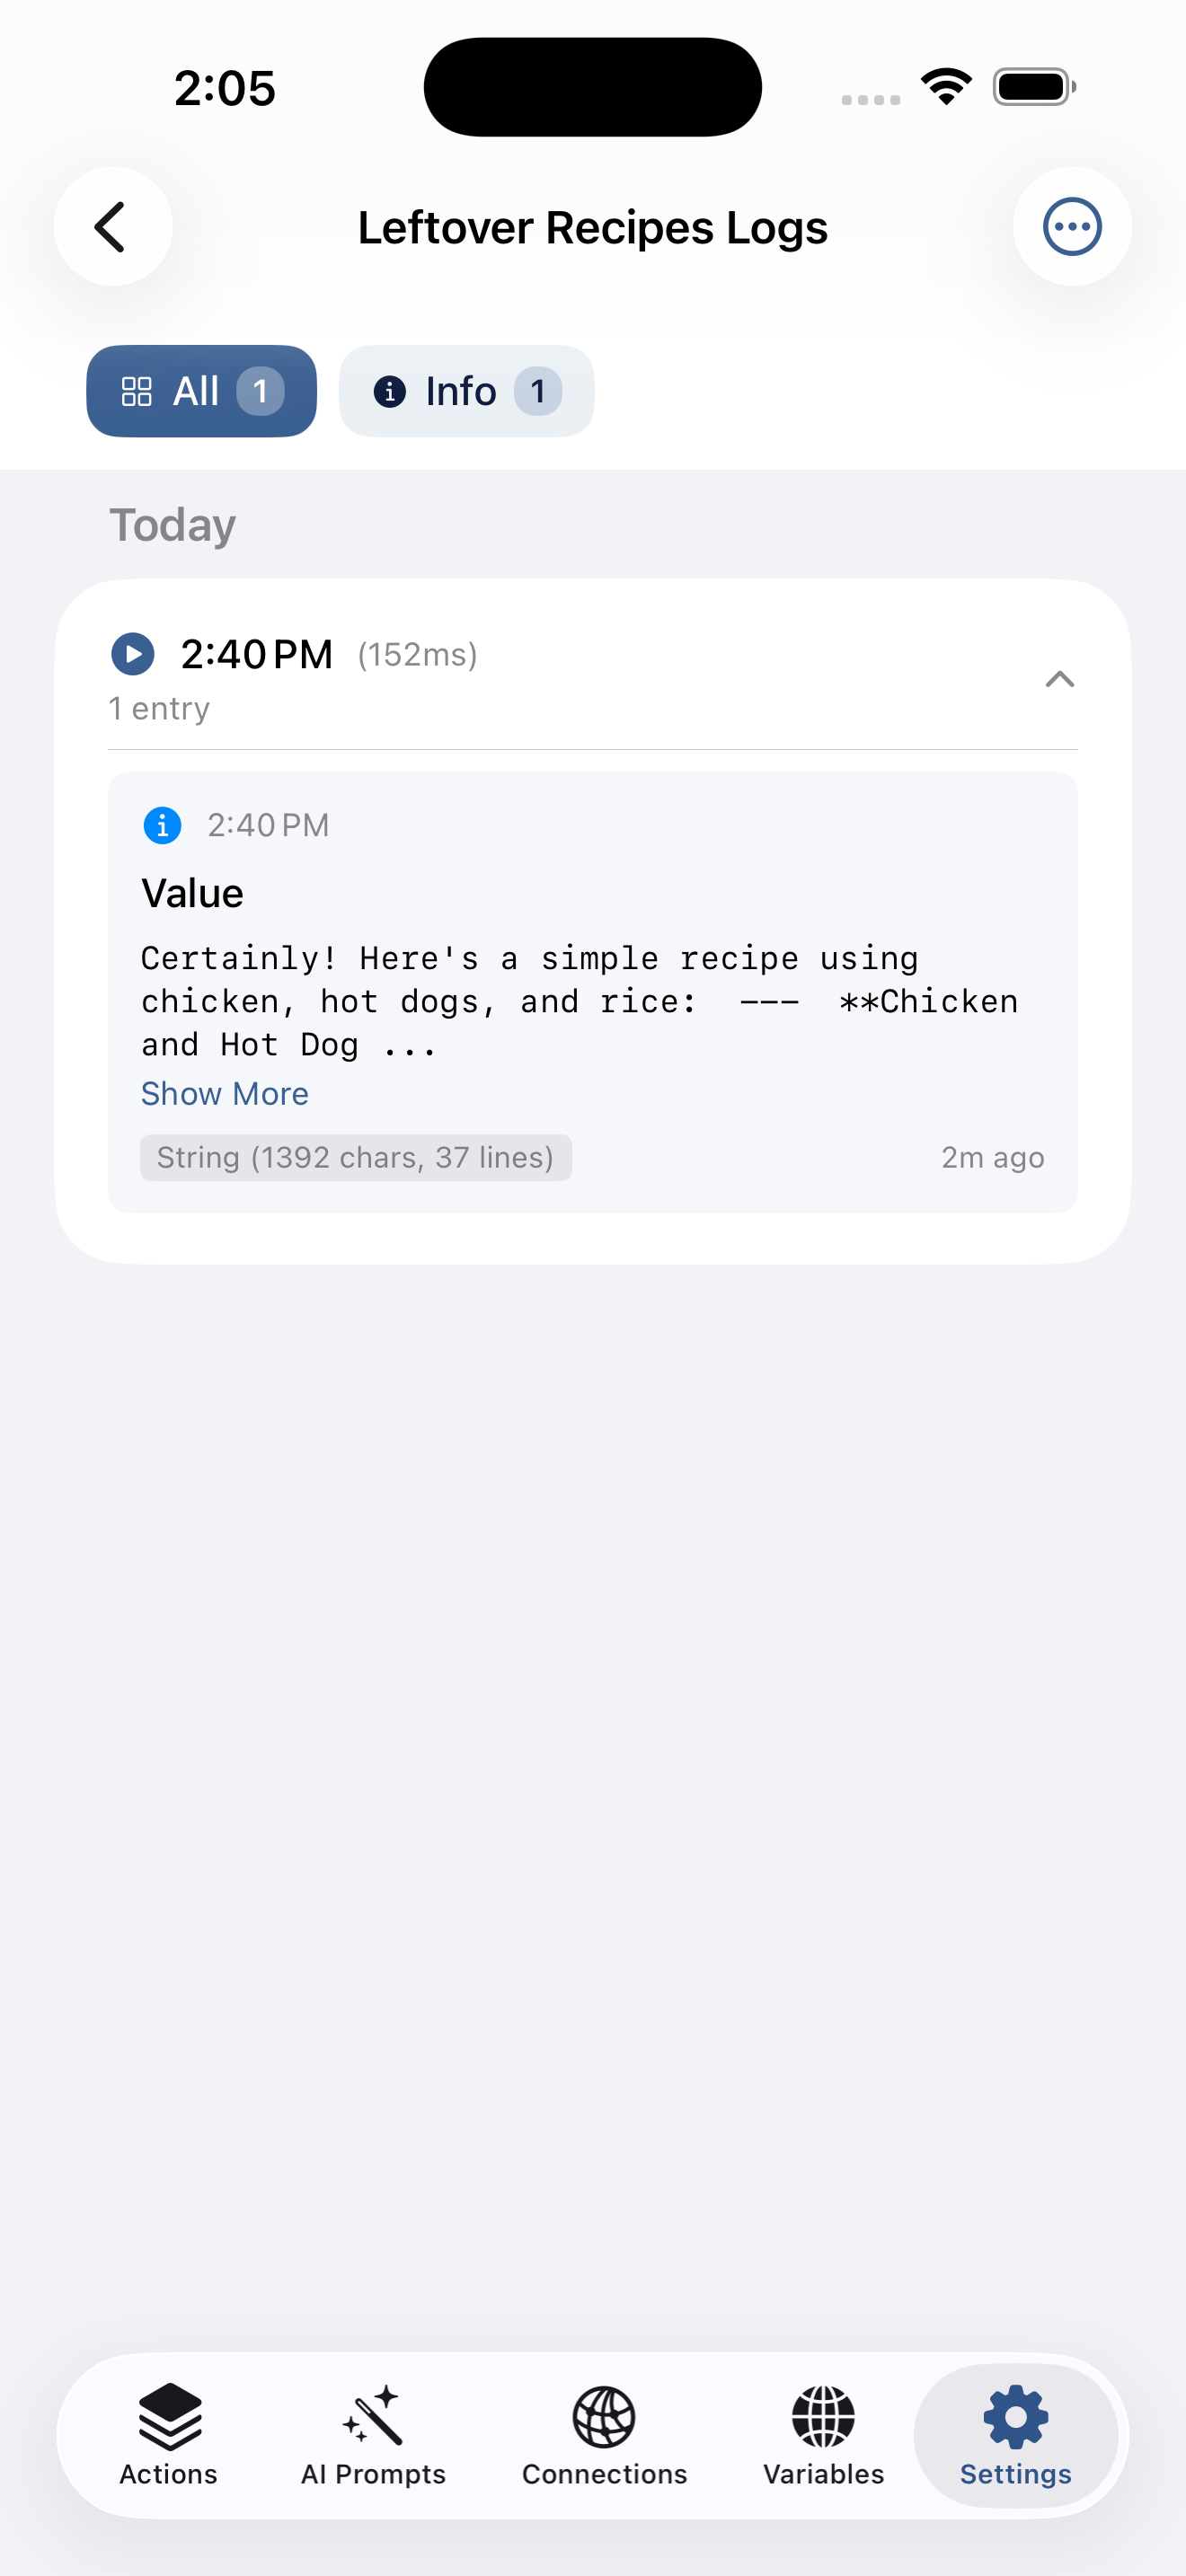
Step 3: View Your Logs
Open Shortcut Actions → Settings → Log Console to view all your logs:
Advanced Logging Patterns
Pattern 1: Error Tracking
If [Condition Failed]
  Write to Log [Error Details]
    Label: "Validation Error"
    Level: Error
    Tag: "validation"
Pattern 2: Performance Monitoring
Get Current Date → StartTime
[Perform Operation]
Get Current Date → EndTime
Write to Log "Operation completed"
  Label: "Duration: [Time Difference]"
  Level: Success
Pattern 3: Conditional Path Tracking
If [UseAI is true]
  Write to Log "Using AI path"
    Level: Info
    Tag: "flow"
Otherwise
  Write to Log "Using manual path"
    Level: Info
    Tag: "flow"
Why Log Console Is Superior
Compared to native methods:
✅ Non-intrusive: Logs don't interrupt your workflow ✅ Organized: Runs are grouped automatically ✅ Filterable: View only errors, or specific log levels ✅ Persistent: Keep logs as long as you need ✅ Contextual: Labels, tags, and timestamps provide clarity ✅ Professional: Color-coded levels make issues obvious
Method 5: JSON Inspection Tools
When working with API responses or complex data structures, viewing JSON is critical. While Quick Look shows raw JSON text, Shortcut Actions provides a specialized JSON Inspector.
Native Approach (Limited)
Quick Look [JSON Response]
This displays JSON as text, but:
- Hard to read nested structures
- Can't navigate through objects easily
- Difficult to extract specific values
- No path information for accessing data later
Shortcut Actions JSON Tools
The app includes powerful JSON inspection features:
- View JSON Action: Opens an interactive inspector with:
- Mobile-friendly tree view
- Expandable/collapsible objects and arrays
- Syntax highlighting
- Type information for each value
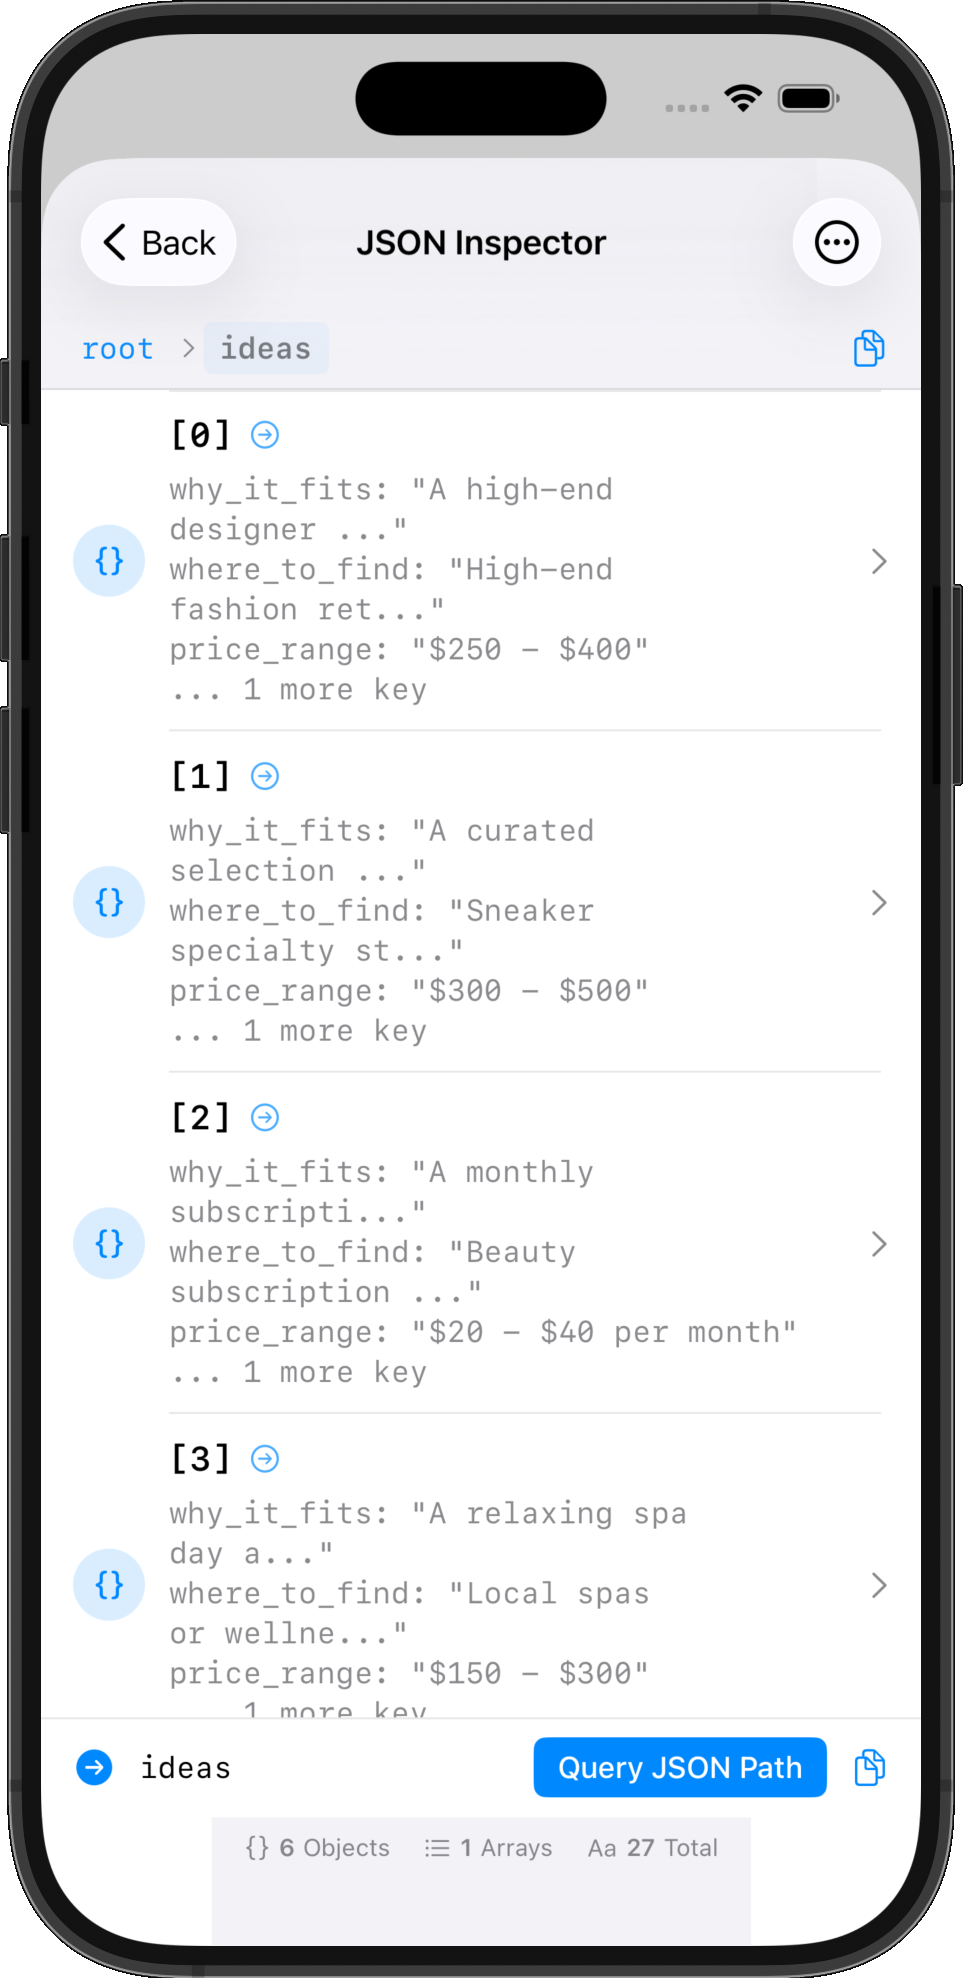
When you expand an array item, you can see all the object properties:
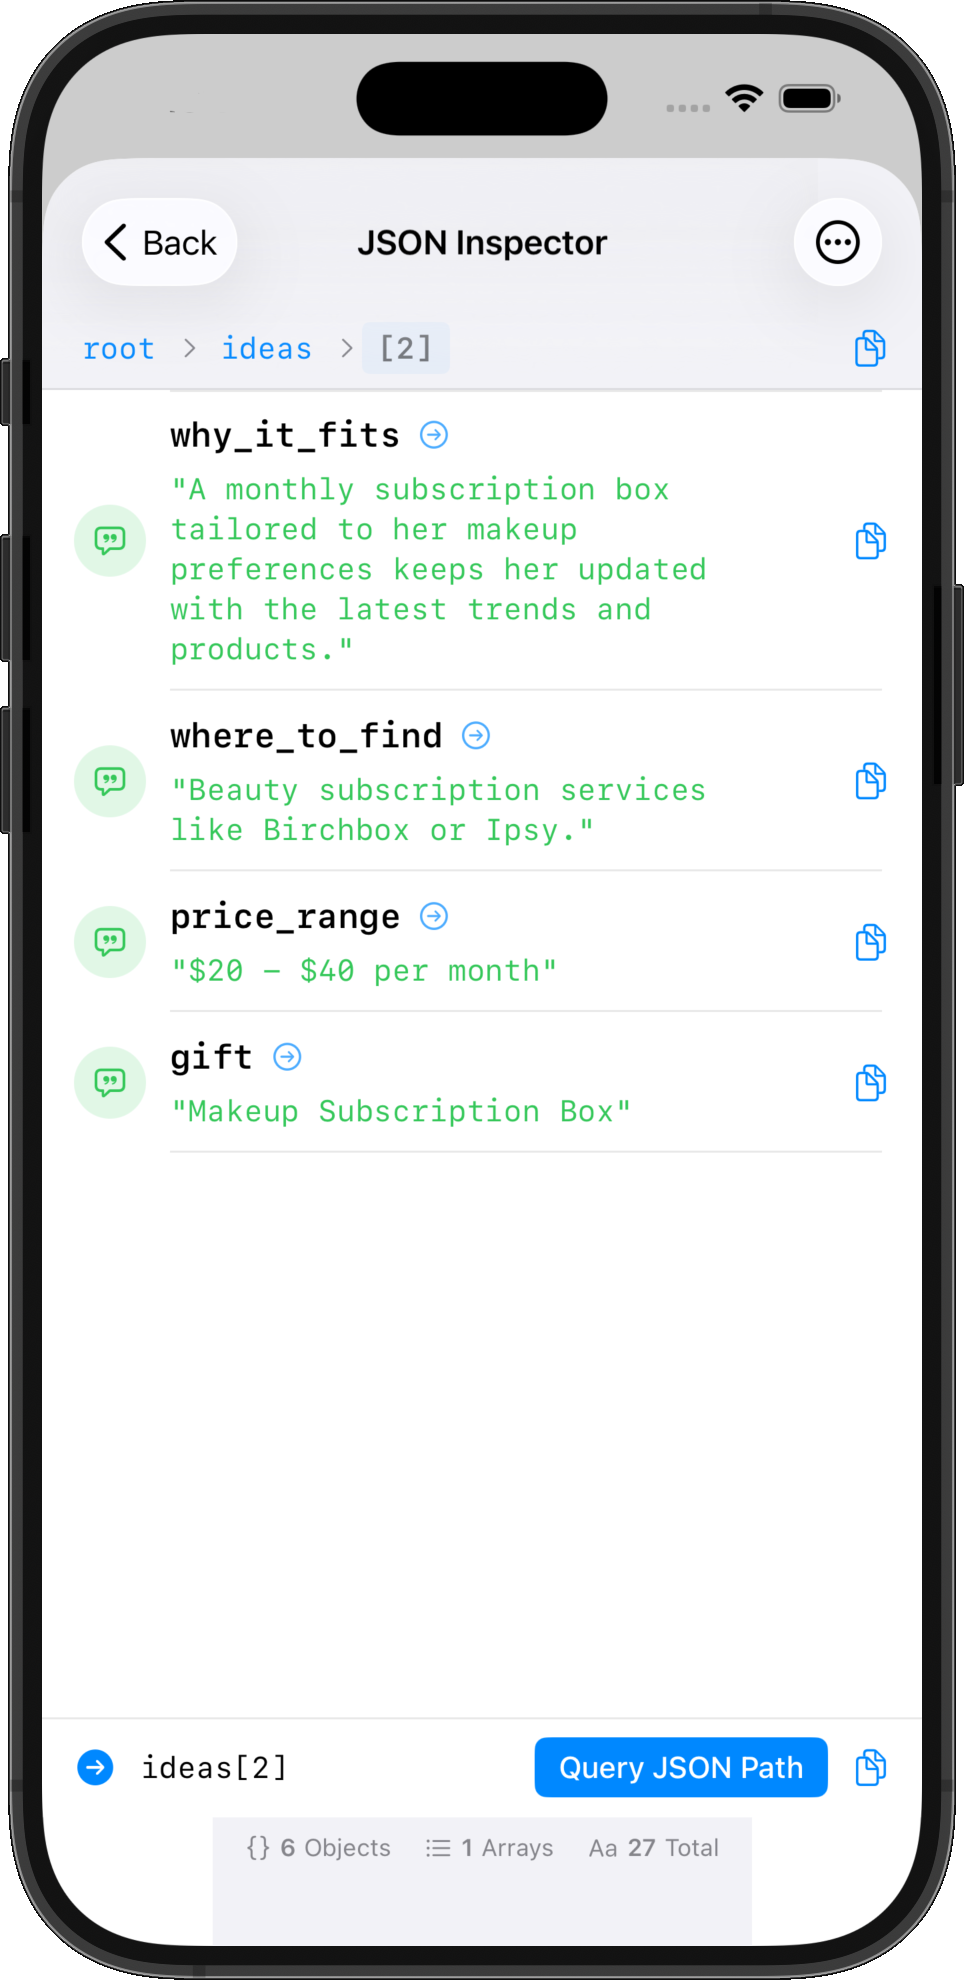
-
Get JSON Value Action: Extract data using JSON path:
Get JSON Value from [APIResponse] JSON Path: "$.data.items[0].name" -
Quick Preview JSON: View and copy JSON in Shortcuts widget without opening the full app
Interactive JSON Path Queries
The JSON Inspector lets you:
- Navigate visually: Tap to expand objects and arrays
- Copy paths: Get the exact JSON path for any value
- Copy data: Extract specific values to use in your shortcut
- Query interactively: Test different paths to find the right data
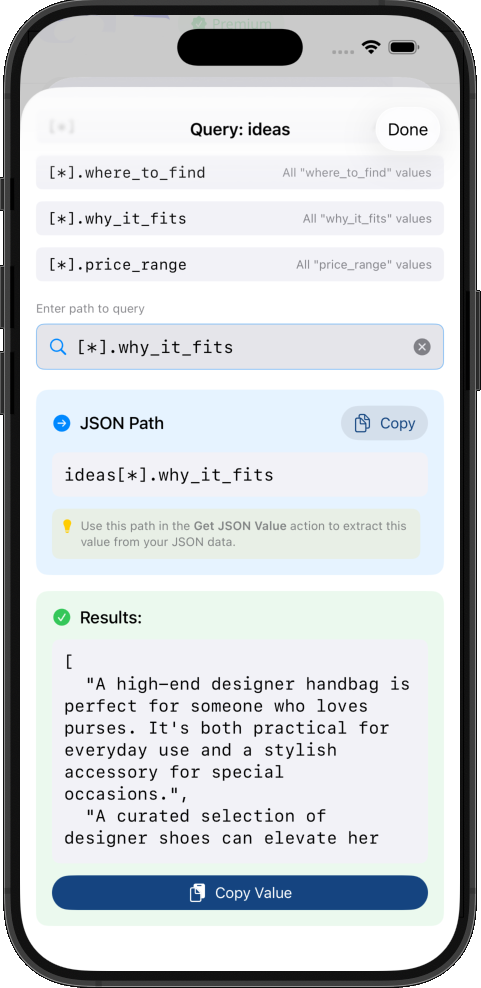
The query interface shows you:
- Available JSON paths from the current context
- Live results as you build your query
- Copy button to use the path in your shortcut
- Syntax-highlighted output
This is invaluable when working with:
- API responses with nested data
- Complex configuration files
- Data transformations
- Third-party service integrations
Example: Testing API Integration
1. Get Contents of URL [API endpoint]
2. View JSON [Response]
   → Opens inspector to explore structure
3. Copy JSON path for the value you need
4. Get JSON Value from [Response]
   JSON Path: [paste path here]
5. Write to Log [Extracted Value]
   Label: "API Result"
   Level: Success
Best Practices for Testing Shortcuts
1. Log Strategically
Don't log everything - focus on:
- Input values at the start
- Key decision points (if/else branches)
- API responses
- Error conditions
- Final output
2. Use Descriptive Labels
❌ Bad: Write to Log [Value]
✅ Good: Write to Log [Value]
         Label: "User selected menu item"
3. Choose Appropriate Log Levels
- Use Debug for verbose details during development
- Use Info for normal flow tracking
- Use Warning for recoverable issues
- Use Error for failures that need attention
4. Tag Related Entries
Use tags to group related functionality:
Tag: "api" for all API-related logs
Tag: "validation" for input validation
Tag: "transform" for data transformations
5. Clean Up Before Deployment
Once your shortcut works:
- Remove debug-level logging (keep info/error/warning)
- Remove Quick Look actions
- Optionally disable logging entirely with a variable toggle
6. Use Clear Previous Strategically
Set Clear Previous: true when:
- Testing changes and old logs are confusing
- Each run should start fresh
- Storage is limited (free tier: 100 entries per log)
Set Clear Previous: false when:
- You want to compare runs over time
- Tracking patterns or intermittent issues
- Building a history for analysis
Comparison Summary
| Method | Pros | Cons | Best For |
|---|---|---|---|
| Quick Look | Built-in, simple, visual | Interrupts flow, no history | Quick single-value checks |
| Set Variable | Non-intrusive, multiple values | No context, lost after run | Simple workflows |
| Show Notification | Works in background | Clutters notifications, temporary | Background automation checks |
| Log Console | Professional, organized, persistent | Requires Shortcut Actions app | Complex workflows, debugging |
| JSON Inspector | Interactive, visual navigation | Requires Shortcut Actions app | API integration, complex data |
Conclusion
Testing and debugging Shortcuts doesn't have to be painful. While native methods like Quick Look and Set Variable work for simple cases, professional workflows demand professional tools.
Log Console provides the visibility and organization you need to:
- Debug complex workflows efficiently
- Track execution history over time
- Identify patterns in failures
- Share debugging information
- Build confidence in your automations
Combined with the JSON Inspector, you have everything needed to work with APIs, process complex data, and build sophisticated automation workflows that actually work.
Next Steps
- Download Shortcut Actions from the App Store
- Add Create Log to your most complex shortcut
- Add Write to Log at key decision points
- Run your shortcut and view the results in Log Console
- Experiment with log levels and tags to organize information
Once you experience organized, persistent logging, you'll never go back to Quick Look debugging again.
Share this article:
Shortcut Actions Team
Building powerful iOS automation tools to help you work smarter.